
Real World Challenges. Simulated
Browse our examples of bespoke simulations. Each was built using The Sim Smithy framework, then assessed against mechanical integrity, learning alignment, strategic depth and playability. Each full assessment is published below. These are demonstration simulations, built from illustrative briefs to show the framework at work. They are not client engagements.
BrightBank: Building the Future
Banking & Capital | Audience: Graduate Intake
4 hours · 12–16 participants in 4 teams · Run by an L&D professional
The Brief
A UK retail bank scenario faced a persistent challenge with its graduate intake: while academically qualified, new hires struggled to grasp the holistic operations of a bank outside their silos. Traditional training on concepts like Net Interest Margin (NIM) and capital ratios provided theory but failed to convey the visceral difficulty of strategic trade-offs.
The Goal: The stakeholder required a clear behavioural shift: graduates needed to instinctively ask, “What does this decision do to our NIM, capital position, and cost-to-income ratio?”
Key Objectives: Understanding Banking Economics, Regulatory Reality, Channel Strategy, and Systems Thinking.
The Solution & Mechanics
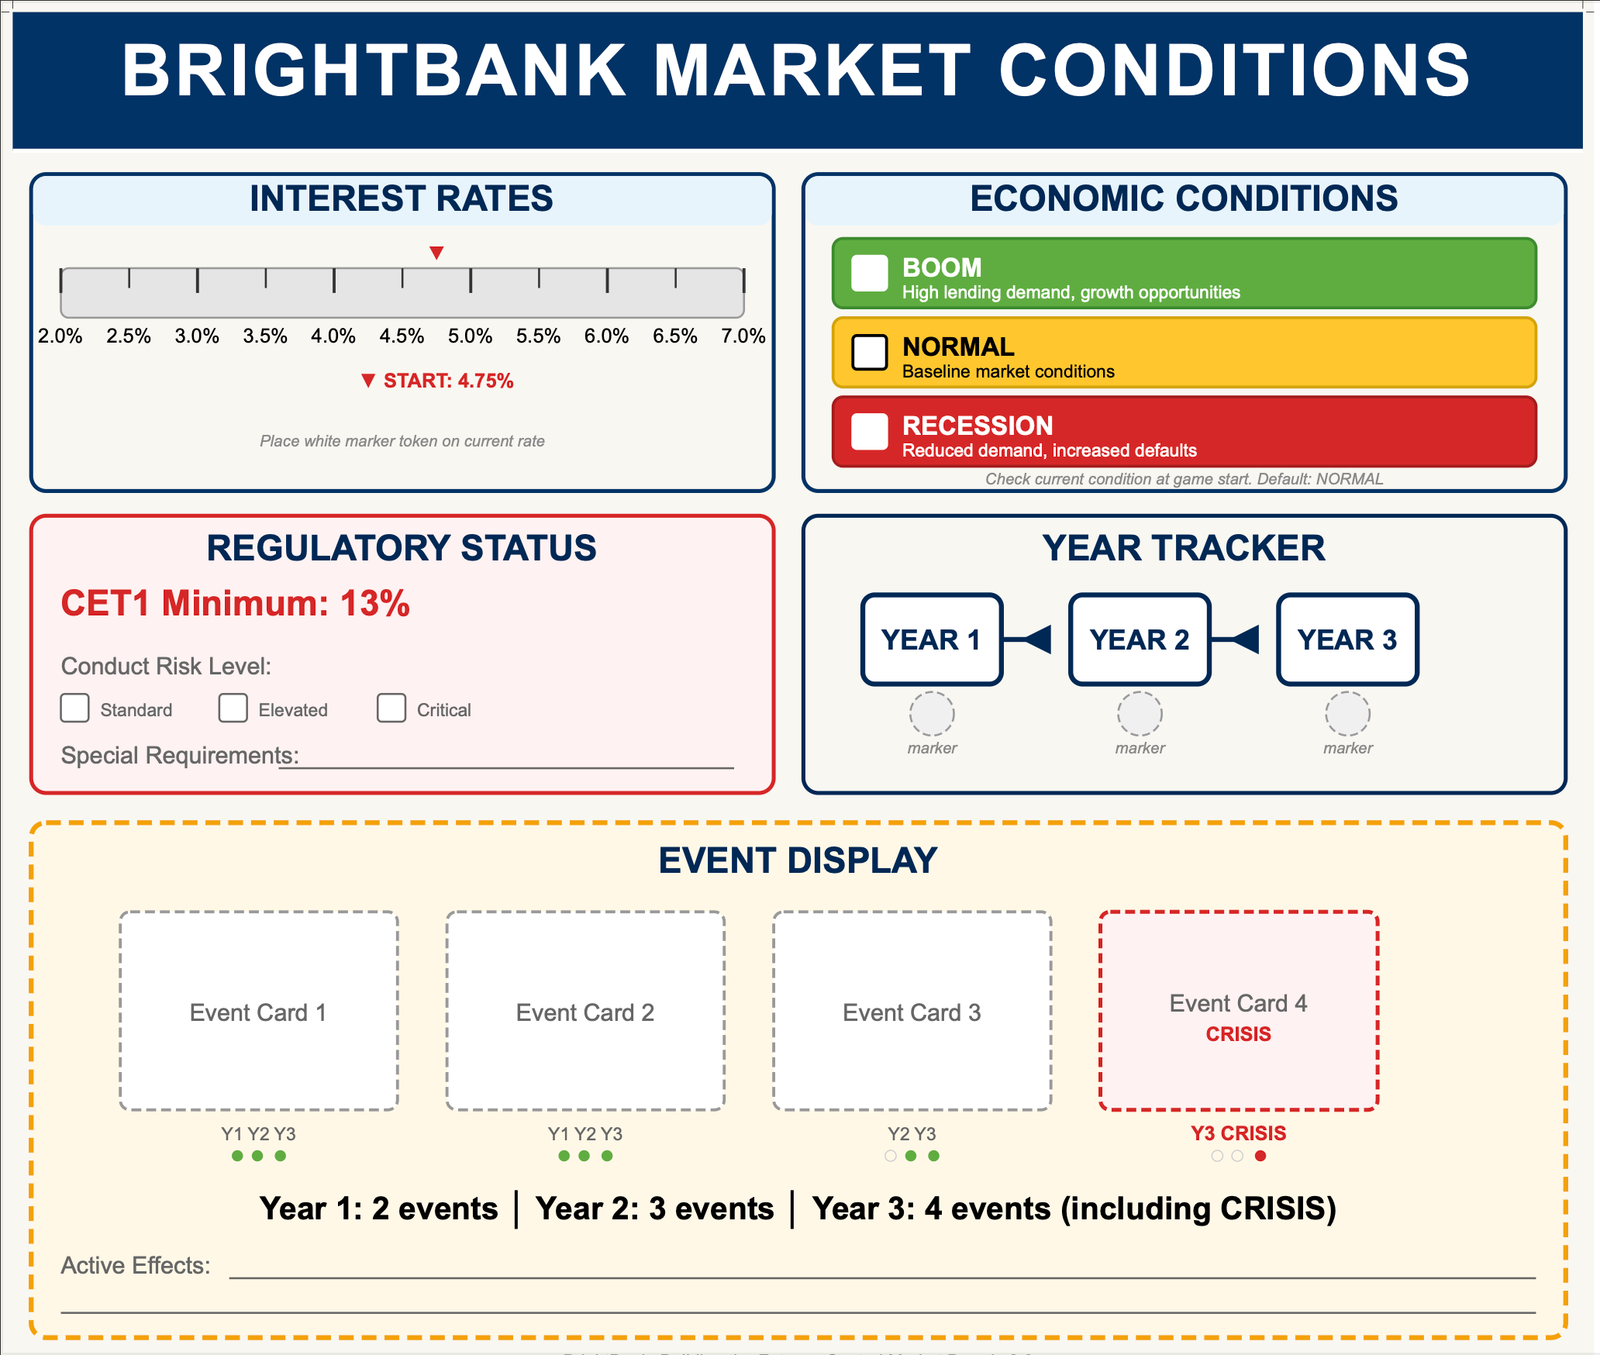
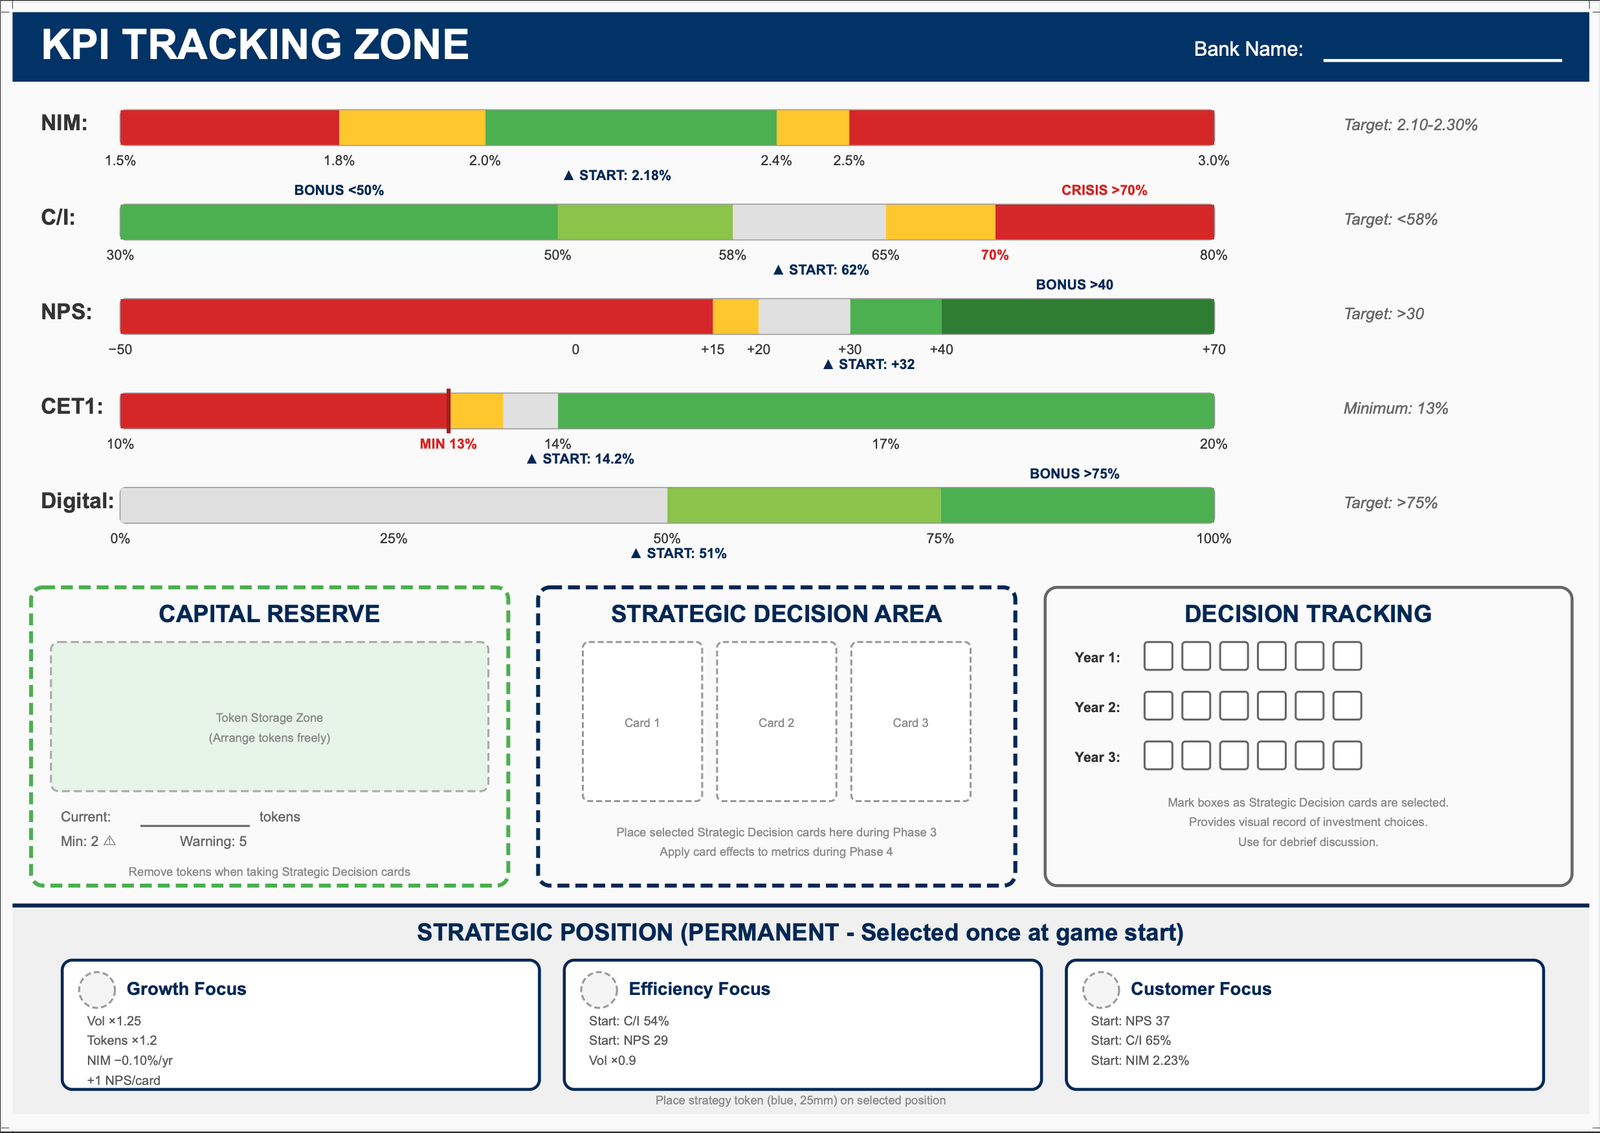
Teams take control of BrightBank, a mid-sized UK retail bank with £68 billion in assets. Over three simulated years, they navigate market shocks and manage five interconnected KPIs on a physical dashboard.
Core Mechanic: Physical Capital Constraint To solve the issue of “abstract” regulation, the simulation uses physical capital tokens. Each team has 30 tokens (representing £3bn regulatory capital). If tokens run out, they cannot lend. This transforms a dry compliance rule into an immediate, physical limitation that shapes every discussion.
Secondary Feature: Dynamic Market Events A deck of 24 event cards introduces external shocks—interest rate hikes, competitor moves, and a guaranteed Year 3 crisis. All teams face identical events but respond independently, allowing for rich comparative debriefs.
Visual Components
Team Dashboard: Tracks NIM, Cost-to-Income, and Capital Ratio with colour-coded scales for immediate feedback.
Central Market Board: Displays the shared economic climate (Boom/Recession) and current interest rates.
Assessment & Specs
Assessment (Claude review)
Alignment with Learning Objectives: The physical token system addresses the brief’s requirement for graduates to “feel” constraints rather than just calculate them. The five tracked metrics (NIM, Cost-to-Income, etc.) map precisely to the banking fundamentals identified as essential learning. The strategic positions create genuinely differentiated pathways, ensuring no single “winning” strategy exists.
Facilitation Design: The design enables general L&D professionals to run the session without specialist banking knowledge, thanks to the comprehensive manual and 15-minute banking primer.
- Mechanical Rigour: Every decision card produces quantified, unambiguous outcomes. The simulation was playtested by AI agents across multiple strategic profiles, confirming balanced scoring with no dominant strategy.
Summary Specifications
Duration: 4 hours (Half-day)
Participants: 12–16 (4 teams)
Complexity: Medium-High (Graduate level)
Physical Components: Capital tokens, team dashboards, central market board, decision cards, event cards
Facilitator Requirement: L&D professional with moderate facilitation experience
Worked example: how one BrightBank decision carries back to work
The decision. In Year 1, a team plays the Mortgage Expansion card at £1bn: 4 of its 30 capital tokens. Growth looks strong, and the capital ratio falls from 14.2% to 13.2%, just above the 13% minimum.
The consequence on the board. Every token spent on lending is capital the bank no longer has. When the guaranteed Year 3 market crash arrives, the crisis-response cards cost 3 or 4 tokens each, and a team that spent early may find them out of reach. When tokens run out, the bank cannot lend, however good the opportunity.
The debrief question. “How did capital constraints affect your lending decisions?” Tables that chased volume compare notes with tables that held capital back.
Back at work. The brief’s goal was for graduates to ask, before backing any proposal, “What does this decision do to our capital position?” The debrief is designed to make that question their own.
See it in the pack: a three-page sample from the BrightBank delivery pack (PDF)
Keystone: The Portfolio Equation
Insurance & Risk | Audience: Underwriters & Portfolio Managers
4 hours · 12–16 participants in 4 teams · Run by an L&D professional
The Brief
The Solution & Mechanics
Core Mechanic: Delayed Claims Emergence
In insurance, premiums are paid today, but claims happen tomorrow. The simulation models this precisely: pricing decisions and policy acquisitions generate delayed loss ratio effects that only materialise the following year. This tempts teams into aggressive, under-priced growth that looks profitable initially — until Years 2 and 3, when the true cost of those decisions destroys their capital.Key Feature: The Concentration Index
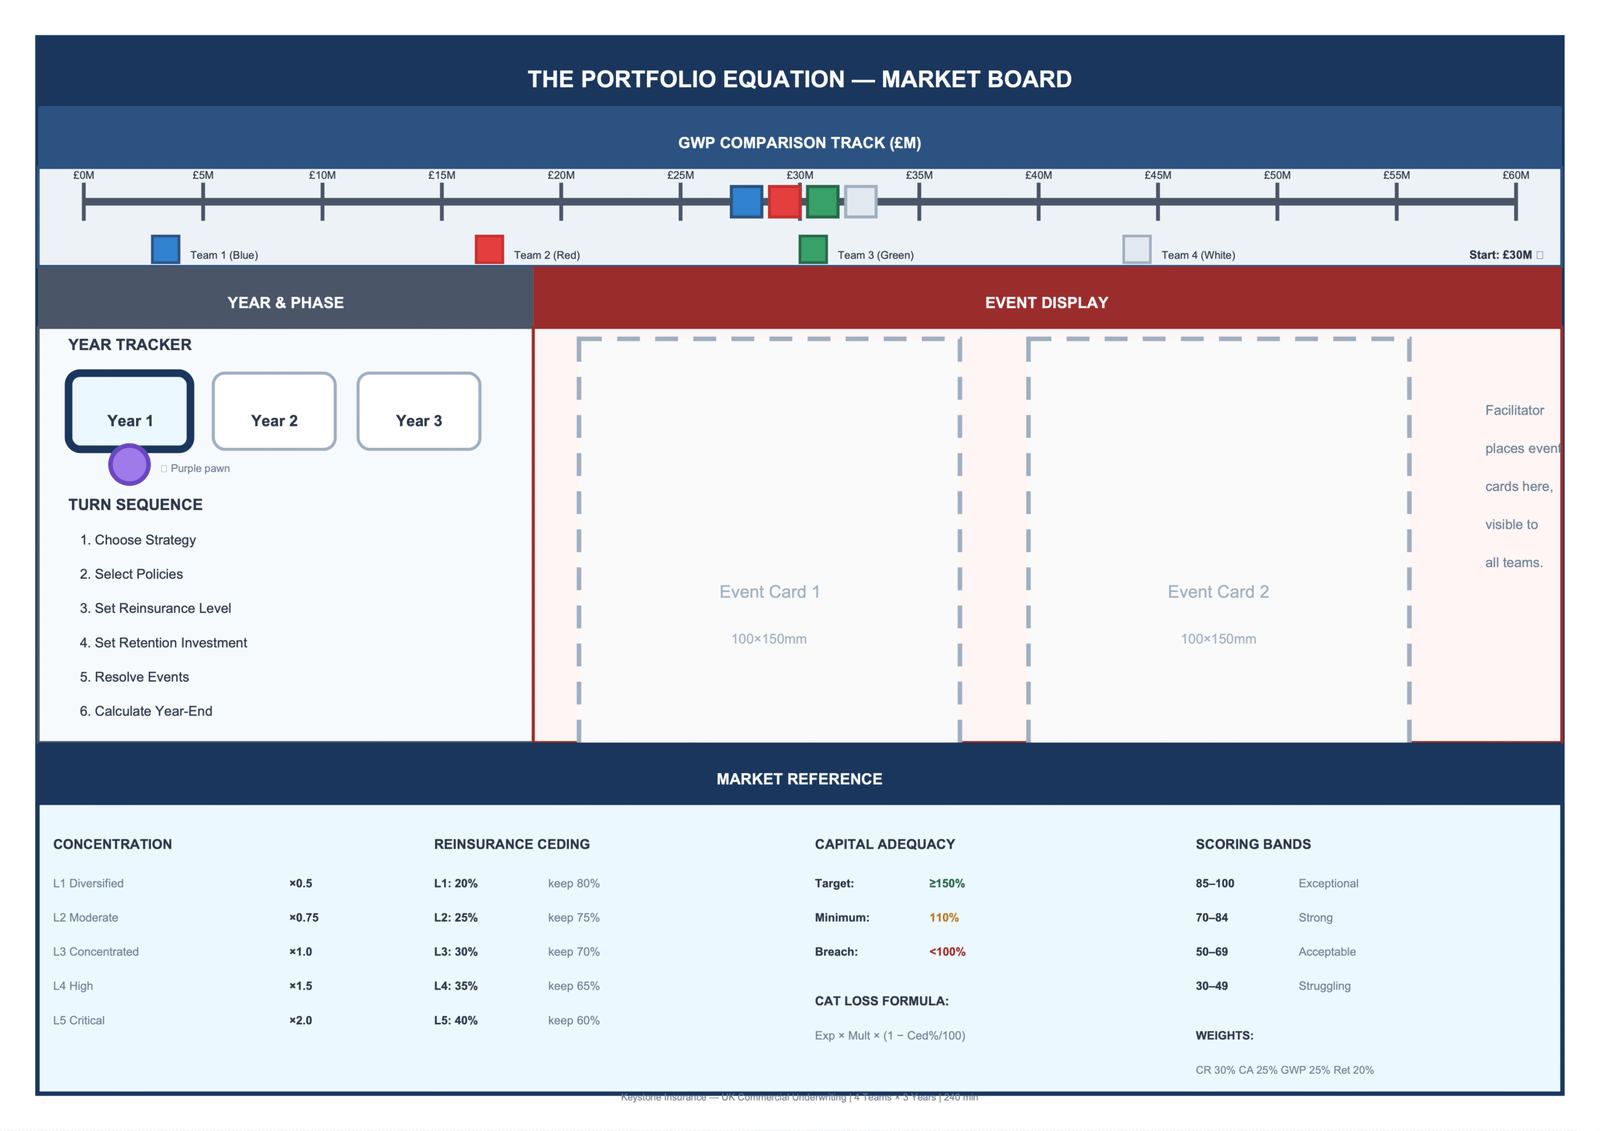
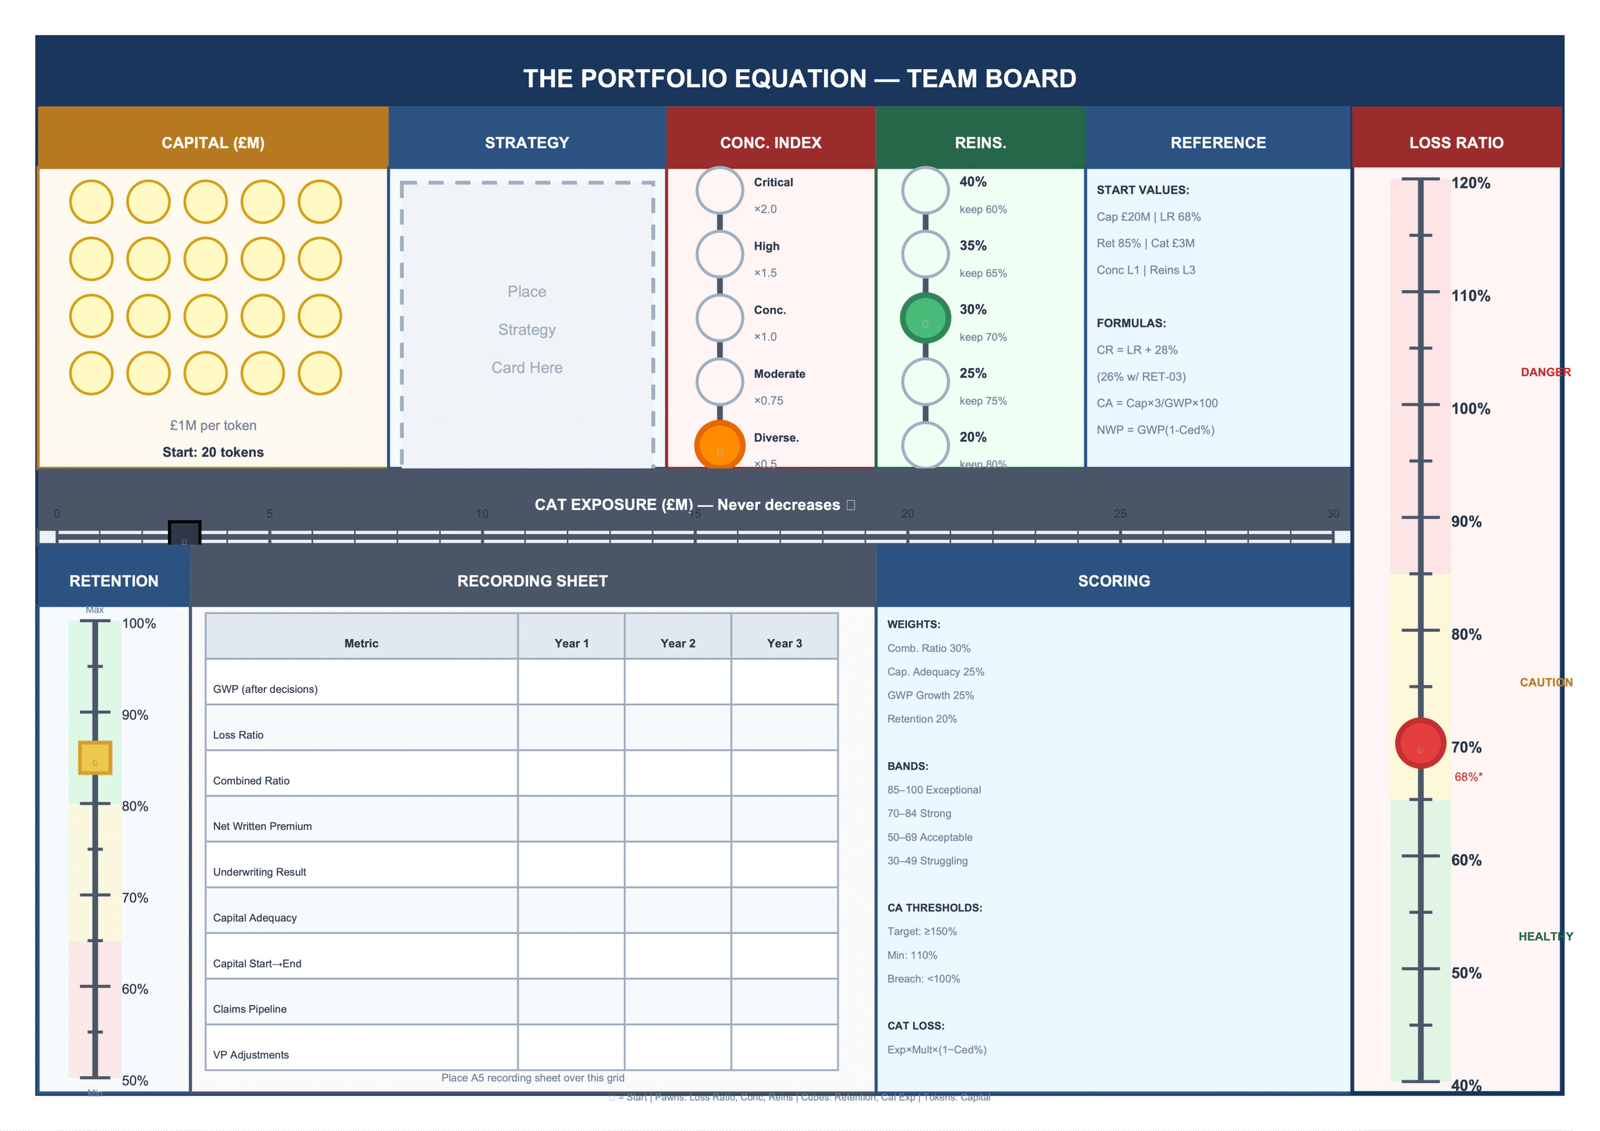
Portfolio concentration is tracked on a single 5-level scale, from Diversified (Level 1) to Critical (Level 5). When catastrophe events strike, losses are multiplied by the concentration level — diversified portfolios pay half the base damage, while critically concentrated portfolios pay double. A team that chased volume without monitoring concentration will suffer dramatically larger losses than a diversified competitor facing the same event.
Assessment & Specs
Assessment (Claude review)
Fidelity to Reality:
The delayed claims emergence mechanic is the simulation’s signature learning tool, replicating the “Year 1 deception” that traps new underwriters. Aggressive pricing looks profitable in Year 1 — until delayed claims materialise in Years 2 and 3 and destroy capital reserves.Strategic Depth:
The combination of one-shot policy cards, reinsurance positioning, and concentration tracking creates genuinely differentiated team strategies. No dominant strategy emerged across validation games — optimal choices depend entirely on current portfolio state, making each team’s decision path unique.Mechanical Rigour:
The simulation was playtested by AI agents across multiple strategic profiles, confirming that every policy card, event response, and strategic decision produces quantified, unambiguous outcomes. The balanced scorecard (Combined Ratio 30%, Capital Adequacy 25%, GWP Growth 25%, Retention 20%) prevents any single-metric strategy from dominating.
Summary Specifications
Duration: 4 hours
Participants: 12–16 (4 teams)
Complexity: Intermediate-Advanced (Professional Level)
Facilitator Requirement: L&D Professional (Insurance expertise helpful but not mandatory)
Project Fusion: The Tech Services Challenge
Tech Services | Audience: Sales Leads, Project Managers, & Delivery Teams
3 hours · 20 participants in 4 teams · Run by a general trainer
The Brief
A global technology consultancy scenario faced a disconnect between their Sales and Delivery functions. Sales teams were “throwing deals over the fence,” winning contracts that were impossible to deliver profitably, while Delivery teams struggled to articulate the commercial impact of scope creep.
The Goal: The firm needed to instil “Commercial Acumen” in new hires, moving them from technical thinking to commercial thinking. The simulation had to force participants to experience the entire “Bid-to-Delivery” lifecycle, realizing that a signed contract is a liability, not an asset, until it is delivered.
The Solution & Mechanics
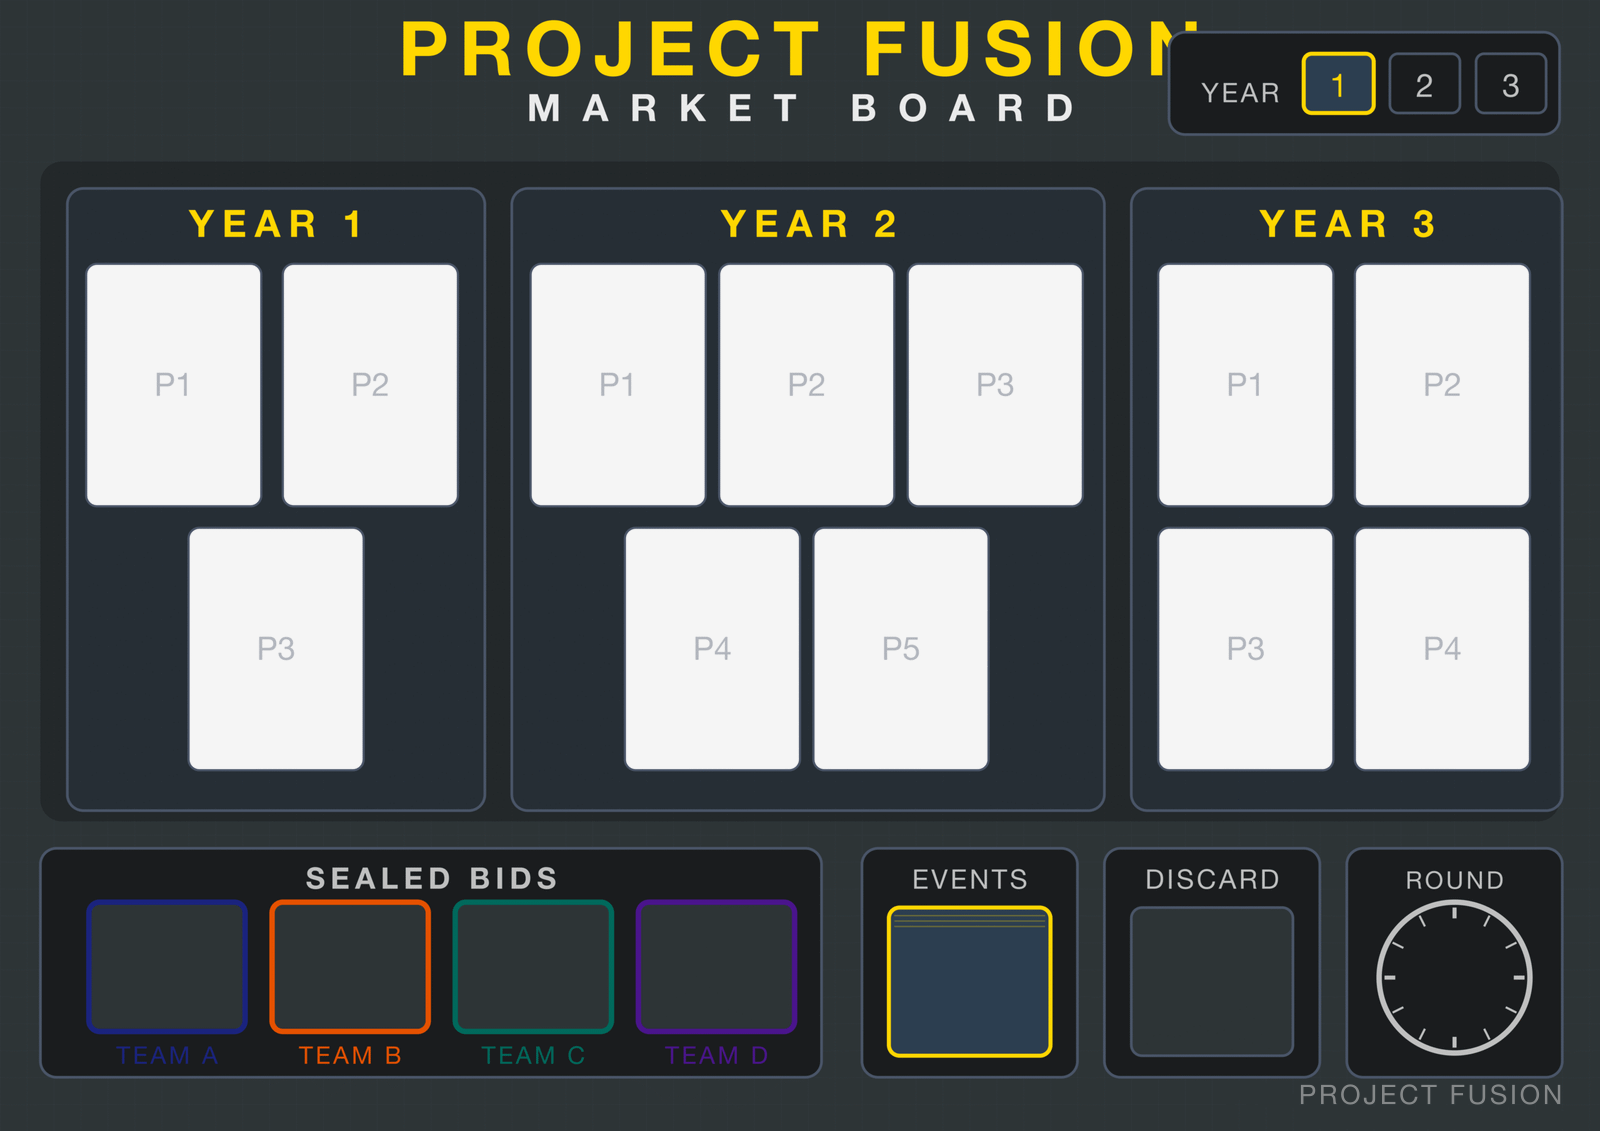
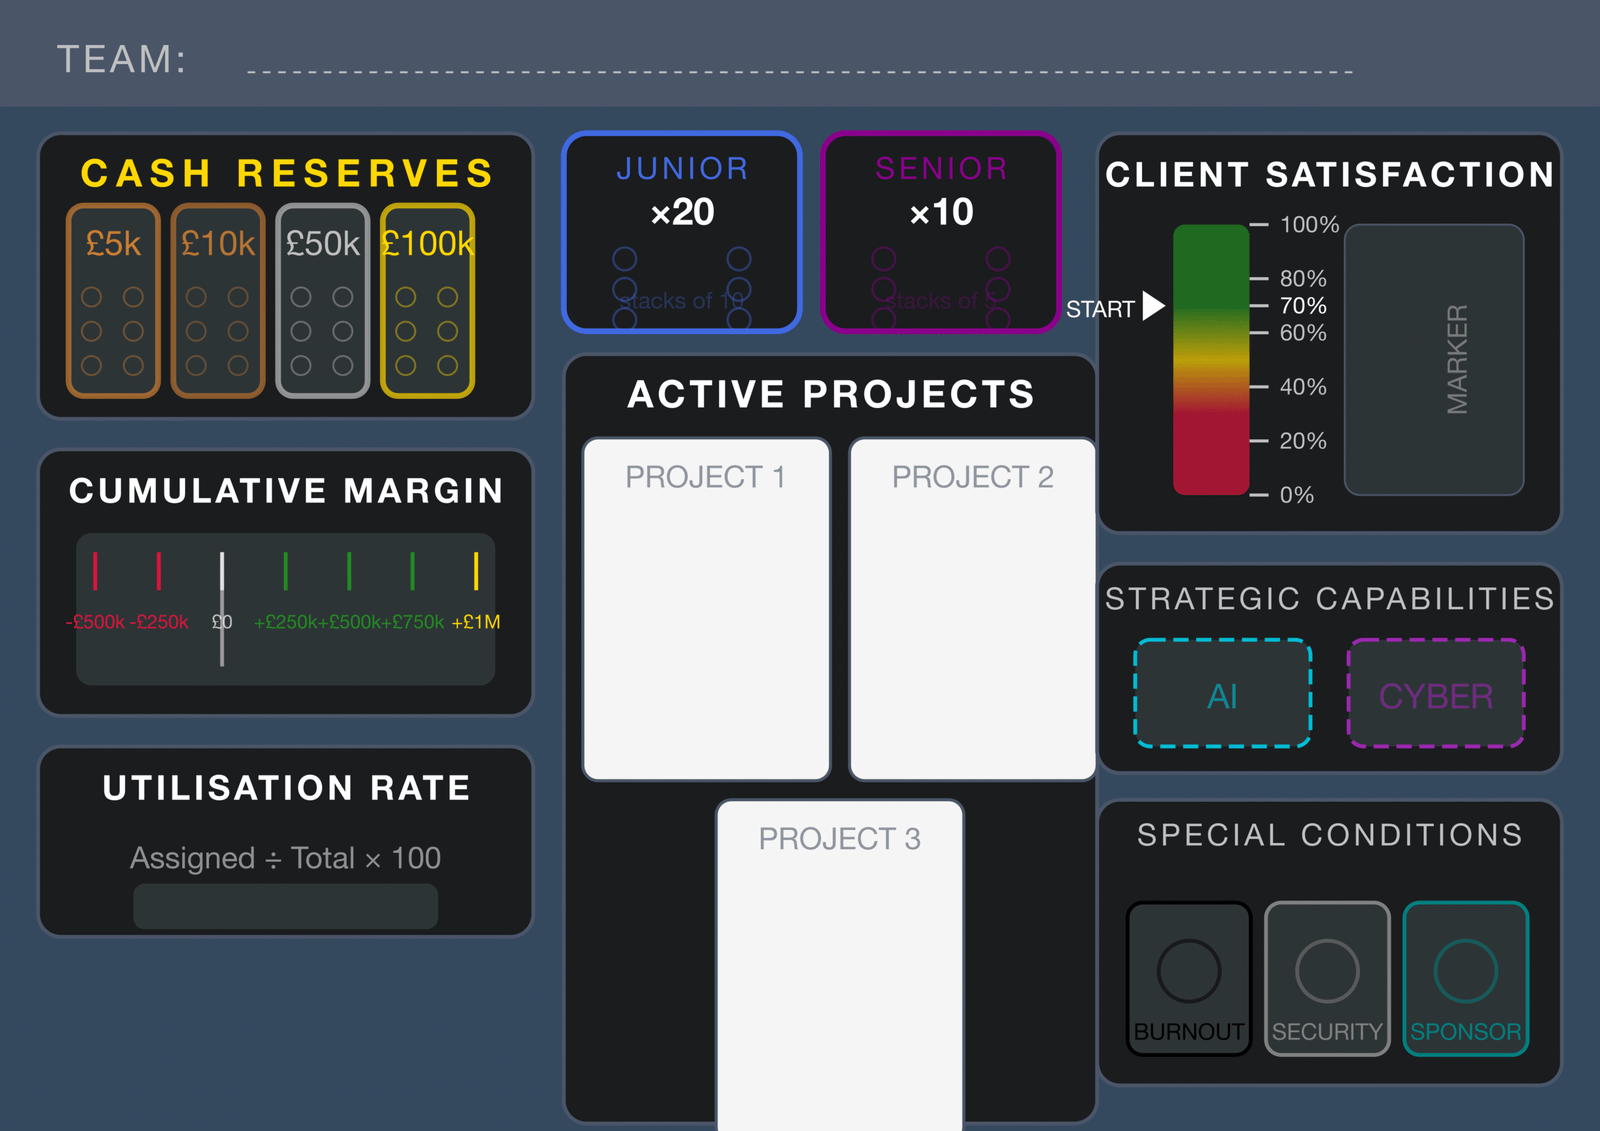
Teams run competing tech consultancies, managing a bench of physical Junior and Senior Consultant tokens. They must navigate the tension between winning work in the Market Phase and executing it in the Delivery Phase, all while managing Utilisation Rates and Client Satisfaction.
Core Mechanic: The Bid-to-Delivery Lifecycle. The game strictly separates “Winning” from “Doing.” Teams who over-promise in the bidding war face an immediate resource crisis in the delivery phase. If you bid for a massive integration project but your Senior Consultants are already committed, you default on the contract—damaging your reputation permanently.
Key Feature: The Utilisation Trap. Profit requires keeping staff busy (billable), but 100% utilisation leaves no slack for crises. Teams must balance the “Bench Cost” of idle staff against the “Burnout Risk” of overworking them.
Strategic Capabilities: As the game progresses, teams can invest cash reserves to unlock AI and Cyber capabilities, allowing them to bid on higher-margin “Specialty Projects” in Year 3—but only if they survived the cash-flow pressure of Year 1.
Assessment & Specs
Assessment (Gemini review)
Behavioural Shift: The design is built to move participants from “technical” to “commercial” thinking. By assigning conflicting role cards (Sales asks “Can we win?”, Commercial asks “What’s our margin?”), the design organically generates the cross-functional debate requested in the brief.
Tangible Scarcity: The use of physical tokens for cash and consultants transforms abstract numbers into visceral limitations – when a team runs out of blue “Junior Consultant” tokens, the capacity crisis is immediately visible and felt.
- Mechanical Rigour: The simulation was playtested by AI agents, confirming that every bid strategy, staffing decision, and event response produces quantified, unambiguous outcomes. The scoring formula’s weighted balance across margin, satisfaction, utilisation, and strategic capability prevents any single-dimension strategy from dominating.
Summary Specifications
Duration: 3 hours
Participants: 20 (4 teams)
Complexity: Medium (Physical Economy + Card System)
Facilitator Requirement: General Trainer (Detailed Scripting provided for “Analysis Paralysis” troubleshooting)
UrbanEdge: The First Three Years
Retail Strategy | Audience: New Hires & Future Leaders
5 hours · 16 participants in 4 teams · Run by a general trainer
The Brief
A fast-growing sustainable fashion retailer scenario identified a critical gap: new hires arrived with deep functional expertise but lacked a holistic view of the business. This led to siloed decision-making—optimising individual departments while harming the overall strategy.
The Goal: The retailer required a behavioural shift. New hires needed to transition from functional specialists to strategic thinkers who instinctively ask: “How does this initiative support our core strategy and what is the impact on Gross Margin?”.
The Solution & Mechanics
Four competing teams take control of UrbanEdge for a simulated three-year period. They operate with full transparency, managing resources to build market share while adhering to strict sustainability goals.
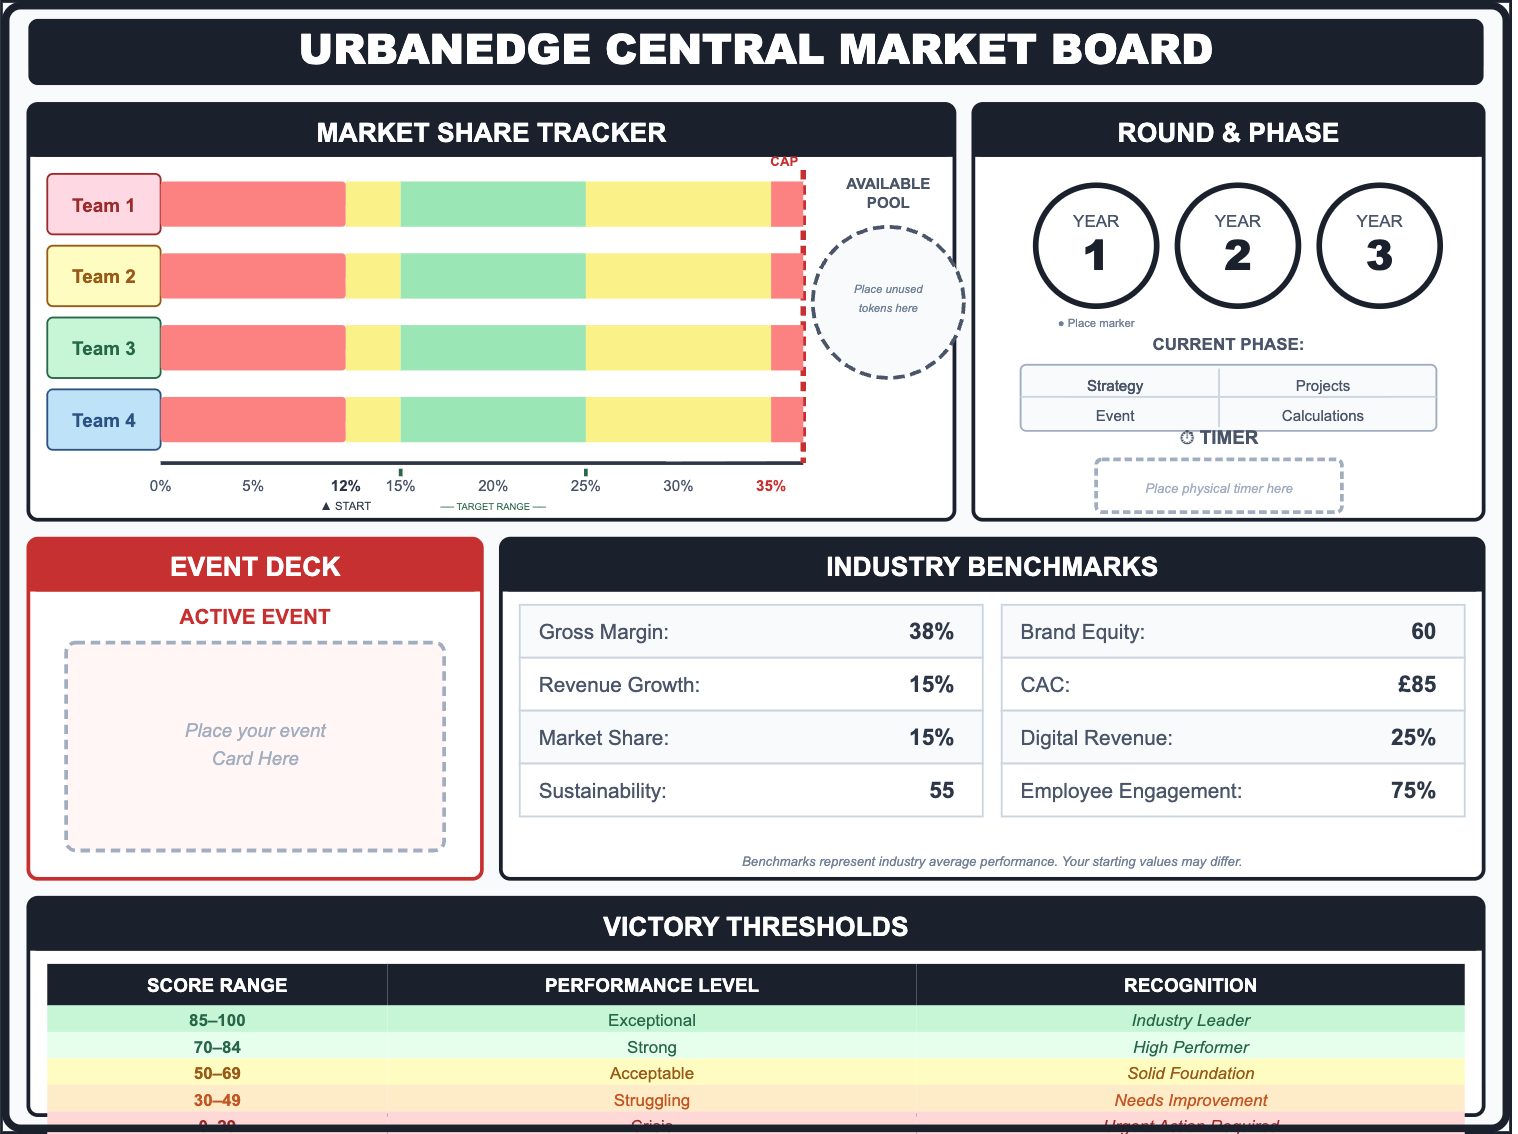
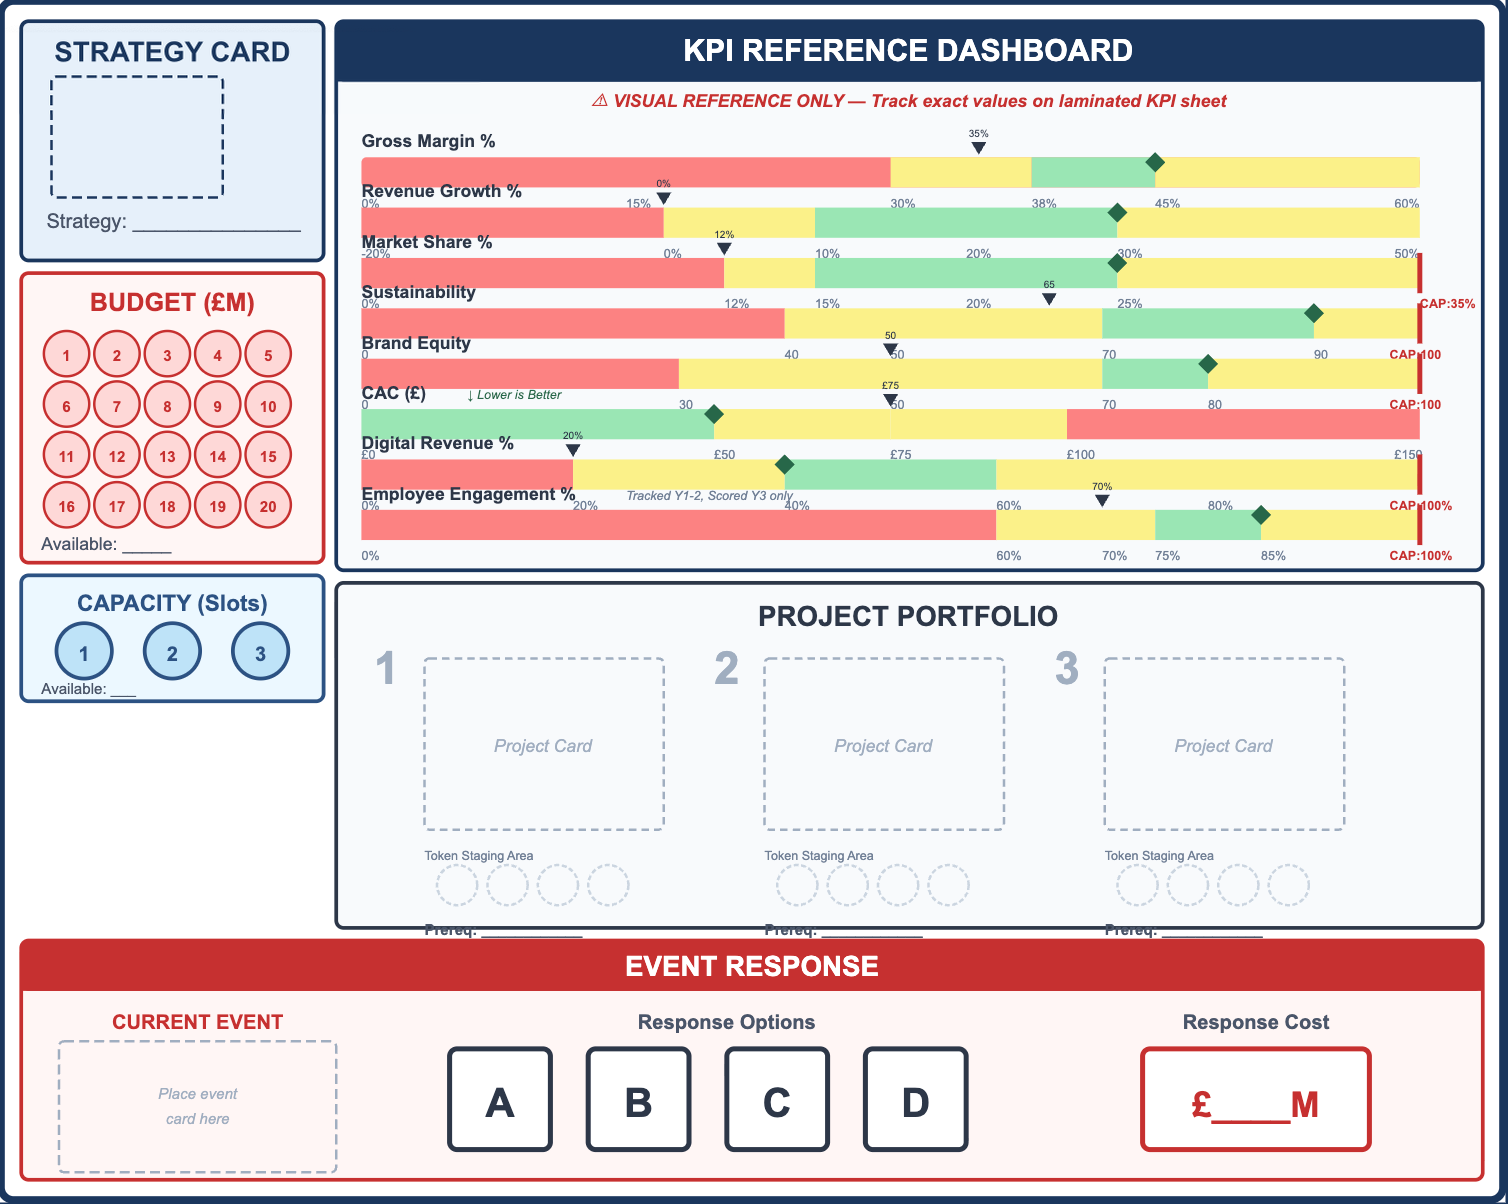
Core Mechanic: Dual-Resource Economy Teams manage two finite currencies: Budget Tokens (Capital) and Capacity Tokens (Time/Focus). They must allocate these across 5–7 strategic projects per year. This forces an immediate trade-off: high-impact sustainability projects often consume the capacity needed for market expansion.
Secondary Feature: Strategic Pillars In Year 1, teams commit to a pillar (e.g., Innovation or Brand Strength). This creates “strategic lock-in,” ensuring Year 3 decisions must be evaluated against Year 1 commitments rather than in isolation.
Assessment & Specs
Assessment (Gemini review)
Breaking Silos: By removing role differentiation and forcing the entire team to agree on a unified strategy, the design removes functional silos from play. The prerequisite system forces long-term planning — Year 3 decisions must be evaluated against Year 1 commitments rather than in isolation.
Tangible Trade-offs: The simulation operationalises the “Sustainability vs. Margin” tension mechanically — ethical materials explicitly cost 30–50% more, forcing teams to feel the cost of their values. The KPI cap system prevents teams from easily maxing out any single dimension, creating a genuine strategic puzzle.
Mechanical Rigour: The simulation was playtested by AI agents across multiple strategic profiles, confirming that every project card and event response produces quantified, unambiguous outcomes. The scoring formula’s balanced weighting across eight KPIs prevents any single-metric strategy from dominating.
Summary Specifications
- Duration: 5 hours
- Participants: 16 (4 teams)
- Complexity: Entry to Mid-Level
- Physical Components: 4 Team Boards, 21 Project Cards, Capital & Capacity Tokens
Facilitator Requirement: General Trainer (KPI Cap Reference Card provided)
ResponseReady: The Dual Mandate
Public Sector | Audience: Project Managers & Executives
4 hours · 12–16 participants · Run by an L&D professional
The Brief
A national protection agency scenario identified a critical mindset gap in their Project Executives. While excellent at delivering planned infrastructure projects (“Planned Surgery”), they treated emergency incidents as frustrating “interruptions” rather than their primary duty.
The Goal: The stakeholder needed to reframe the operating model. The simulation had to force Project Managers to master the “Mode Switch”—instantly pivoting from rigid Gateway governance to high-stakes incident response—without neglecting the strict audit trails required by government spending rules.
The Solution & Mechanics
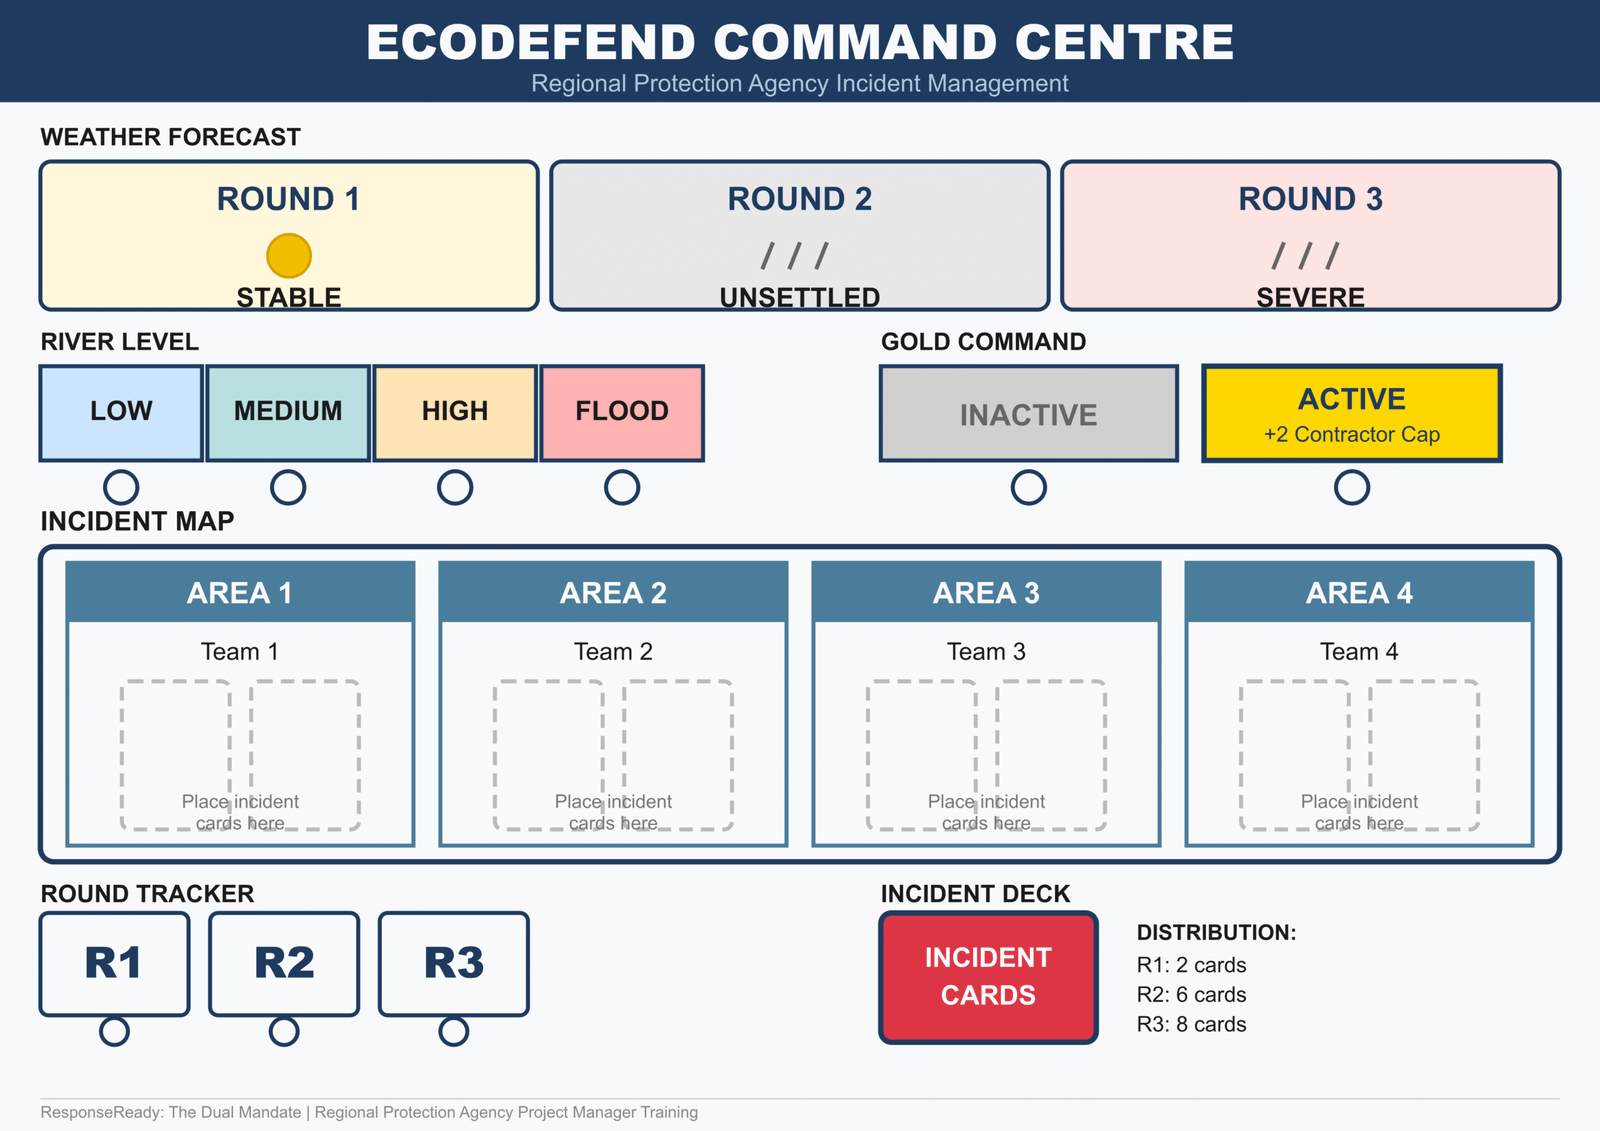
Teams manage a portfolio of capital projects (managing Business Cases and Gateway Reviews) while simultaneously staffing an Incident Response rota. They must balance the “Iron Triangle” of project delivery against the unpredictable demands of Gold Command escalations.
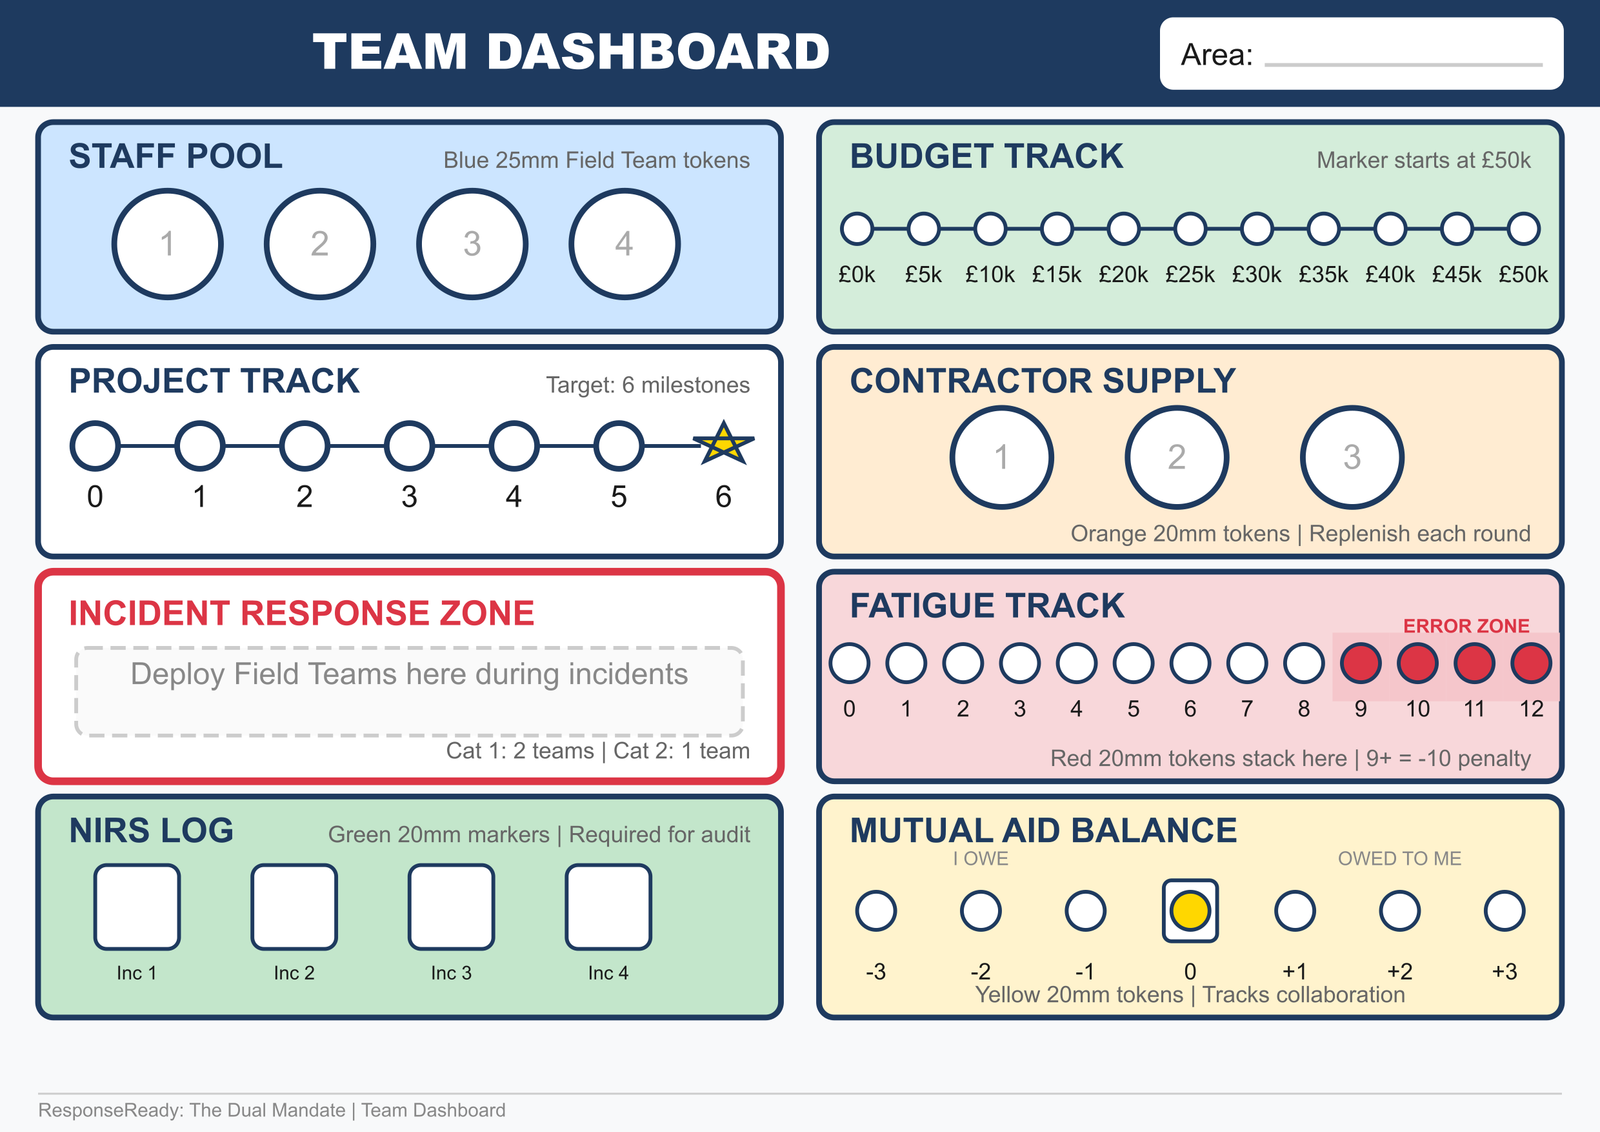
Core Mechanic: The Interrupt System. Incidents are not scheduled—they physically interrupt play. When a “Category 1” event hits, teams must physically halt their Business Case review, stop the timer, and redeploy their limited Staff Pool to the Incident Response Zone. This visceral “Mode Switch” makes the trade-off between project delivery and public safety impossible to ignore.
Key Feature: Compliance Debt (The NIRS Log). In the heat of a crisis, teams are tempted to skip the paperwork to “get the job done.” The simulation tracks this via the NIRS Log (National Incident Recording System). If teams fail to log decisions, “Compliance Debt” accumulates quietly—only to detonate during the Round 3 Audit, proving the painful lesson: “If it’s not in the system, it didn’t happen.”
- The Fatigue Track: Over-using staff without rest pushes them into the Error Zone on the Fatigue Track, forcing players to make difficult ethical choices between burning out their team or missing a deadline.
Assessment & Specs
Assessment (ChatGPT review)
Fidelity to Reality: The assessment confirms the simulation “mirrors the real-world collision between ‘planned surgery’ and ’emergency room’ work exactly as specified,” successfully operationalising the agency’s “Dual Mandate”. The interrupt mechanic is structurally unavoidable — not merely encouraged.
Behavioural Impact: The “Ruthless Triage” logic is deeply embedded. Teams quickly learn that “doing nothing is often the correct operational choice” for low-priority incidents, practising restraint rather than over-responding to noise. The “Compliance Debt” mechanic transforms abstract bureaucracy into a genuine tactical pressure.
Mechanical Rigour: The simulation was playtested by AI agents, confirming that every incident response, project decision, and resource allocation produces quantified, unambiguous outcomes. The scoring formula’s balanced weighting across project delivery, incident response, compliance, resource efficiency, and collaboration prevents any single-dimension strategy from dominating.
Summary Specifications
Duration: 4 hours
Participants: 12—16 (Flexible Team Structures)
Complexity: Intermediate-Advanced (Public Sector / Governance Focus)
Facilitator Requirement: L&D Professional (Subject Matter Expertise not required due to script depth)
CyberResponse: The First 72 Hours
Cyber Resilience | Audience: Senior Leadership & Crisis Teams
3 hours · 8–20 participants in 2–4 teams · Run by an L&D professional
The Brief
A mid-sized financial services firm faced a growing board-level concern: if a major cyber incident struck, would the senior leadership team know how to coordinate an effective cross-functional response? Technical teams had playbooks, but executives lacked practical experience of the real-time trade-offs between containment, regulatory compliance, stakeholder management, and business continuity.
The Goal: The simulation had to force senior leaders to experience the collision of competing priorities during a ransomware crisis — making visible the consequences of delayed communication, regulatory
non-compliance, and single-track technical thinking — all within a realistic 72-hour compressed timeline.
Key Objectives: Cross-Functional Coordination, Regulatory Awareness, Stakeholder Management, Resource Prioritisation under Pressure, and the Ransom Dilemma.
The Solution & Mechanics
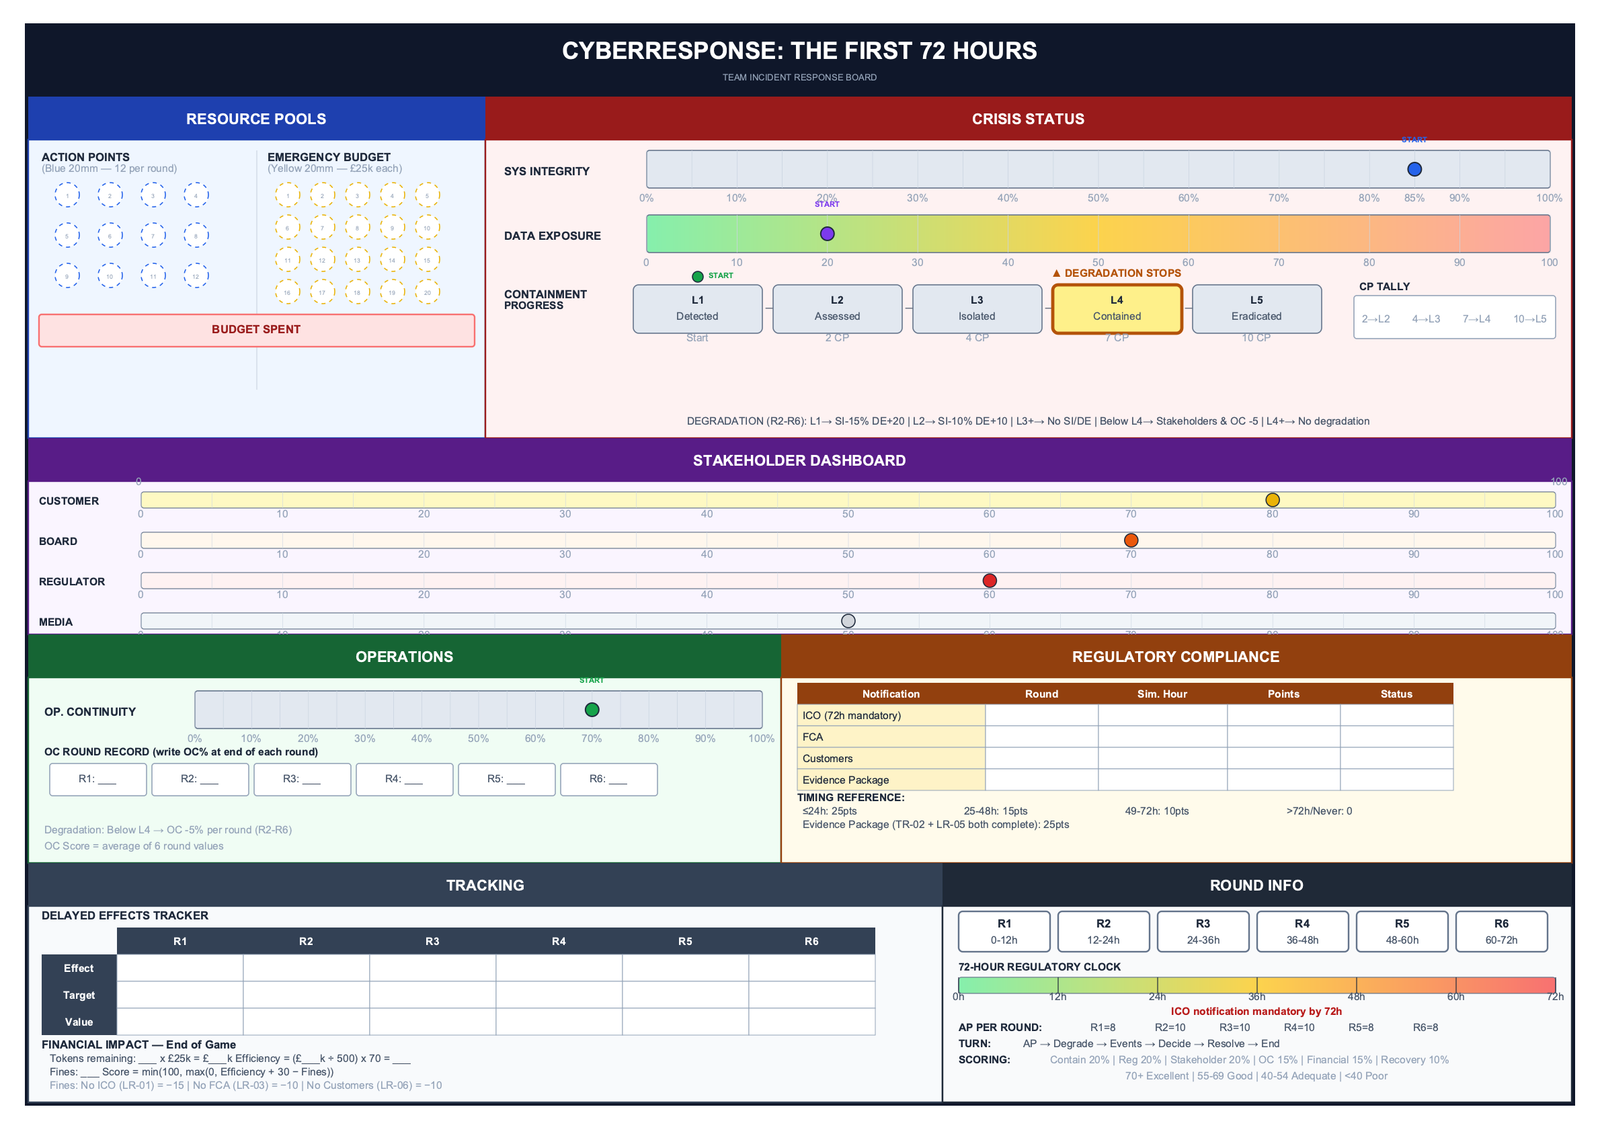
Teams assume the role of a financial services executive crisis team responding to a ransomware attack over six rounds, each representing 12 hours. They manage nine interconnected board metrics — system integrity, data exposure, operational continuity, four stakeholder groups, containment progress, and regulatory compliance — while allocating scarce Action Points and a finite budget across four competing response categories.
Core Mechanic: The Degradation Clock. Until the team achieves containment, every round automatically degrades system integrity, increases data exposure, and erodes stakeholder confidence. The longer containment takes, the worse the compounding damage — making every delayed decision visibly costly on the board.
Key Feature: The Regulatory Clock. ICO and FCA notification deadlines run in parallel with the technical crisis. Filing early earns maximum compliance points; filing late incurs fines. Teams must decide whether to divert leadership attention from containment to compliance — exactly the tension real incident response teams face.
The Ransom Dilemma. A mid-game event forces the team to confront a direct ransom demand with four mechanically distinct options — negotiate, refuse, report to law enforcement, or stall. No option dominates; each creates different downstream consequences across stakeholder confidence, regulatory standing, and containment progress.
Assessment & Specs
Assessment (Claude review)
- Strategic Depth: Every round presents genuine trade-offs between containment speed, regulatory compliance, stakeholder management, and budget preservation. No single strategy dominates — teams must choose their pain.
- Educational Value: All seven learning objectives surface naturally through mechanics rather than facilitator narration. The debrief potential is strong because the board state tells a story — teams cannot hide from the consequences of their own decisions.
Mechanical Rigour: The simulation was playtested by AI agents across multiple strategic profiles, confirming that every decision card and event response produces quantified, unambiguous outcomes. The scoring formula’s weighted balance across six dimensions (containment, compliance, stakeholder confidence, operational continuity, financial impact, and recovery time) prevents any single-function strategy from dominating.
Summary Specifications
- Duration: 3 hours
- Participants: 8—20 (2—4 teams of 4—5)
- Complexity: Intermediate-Advanced (Executive level)
- Physical Components: Crisis dashboards, event cards, decision cards, token sets, dice
- Facilitator Requirement: L&D Professional (no cyber security expertise required)
Ready to explore what a simulation could look like for your team?
A scoping call is free, with no commitment – just a conversation about your learning objectives